
The spring market is finally making itself felt in Toronto. The Dwelly Toronto Rent Report analyzed data released by the Toronto Real Estate Board (TREB) in April 2019 across Toronto neighbourhoods. This report's goal is to provide a comprehensive view of the current state of the rental market trends by showcasing the most and least expensive neighbourhoods alongside their respective rental growth rates. The report only considers neighbourhoods that had at least five properties leased using TREB's MLS system throughout the month.
Neighbourhoods Ranked By Rent
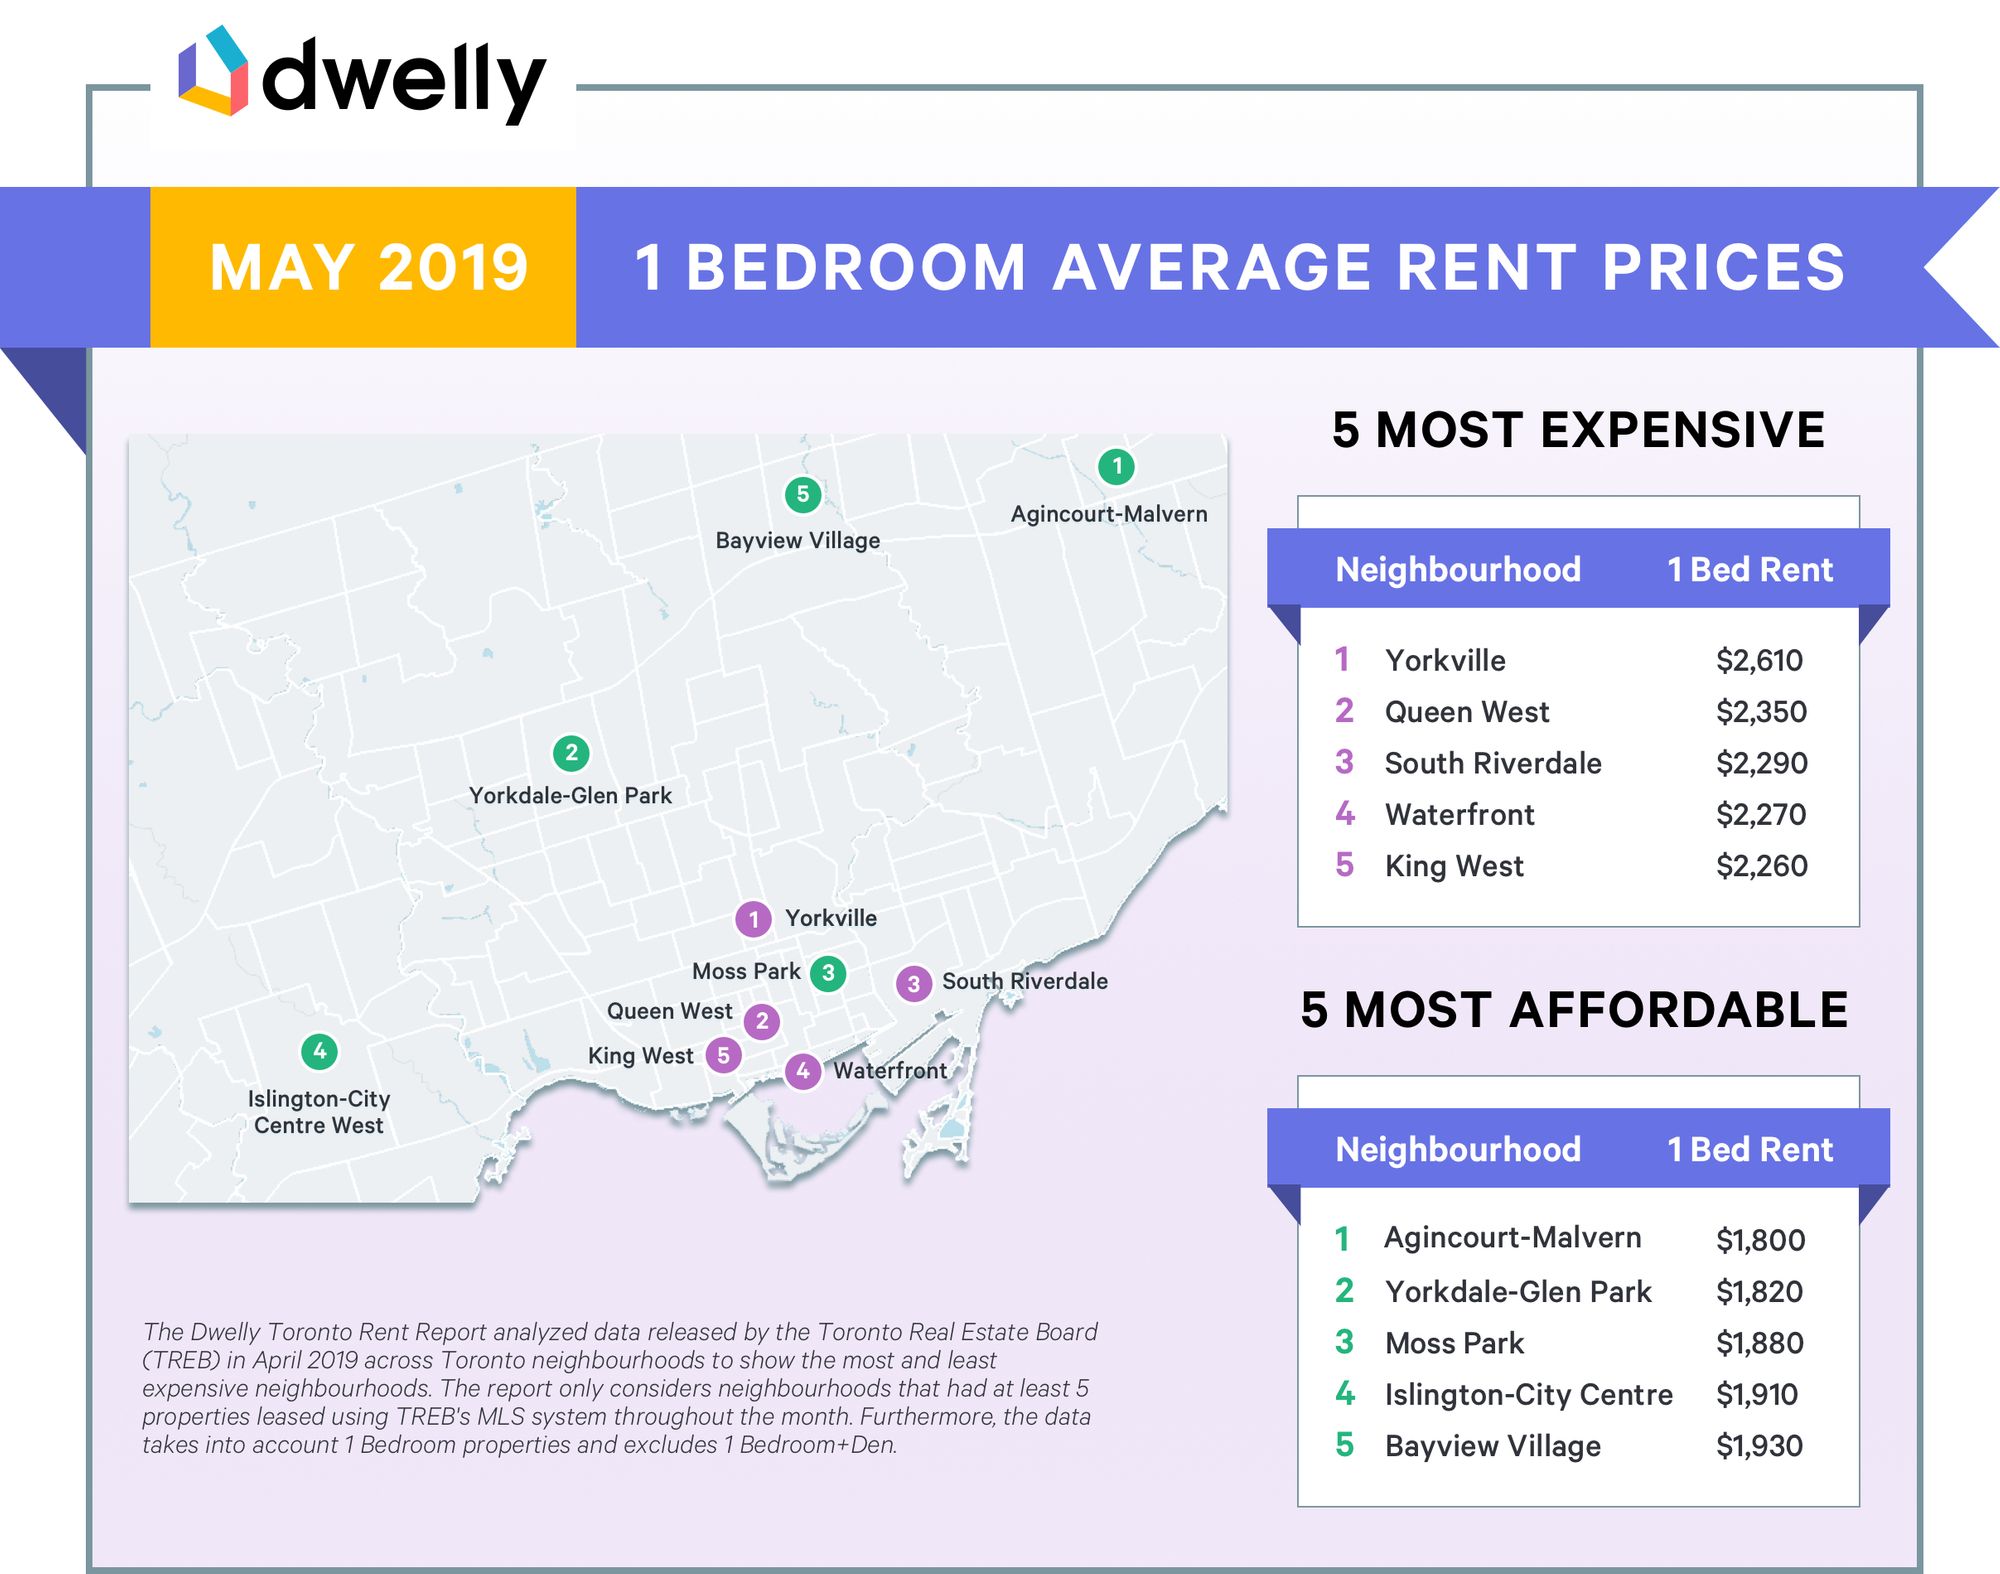
The Most Expensive Neighbourhoods
- Continuing its streak, Yorkville stayed in the top spot for most expensive neighbourhood with an average monthly one bedroom rent of $2,610.
- The biggest mover in the top 5, Queen West, which saw a 12% month-to-month increase from $2,090 to $2,350 claimed the second place for most expensive neighbourhood this month.
- South Riverdale climbed to the third place with an average monthly rent of $2,290 based on seven one-bedroom leases in April.
- Waterfront climbed to fourth place after seeing close to a $100 month-to-month increase with an average monthly rent of $2,270.
- Located in the Downtown area, King West claimed fifth place with an average monthly rent of $2,260, despite seeing a modest month-to-month decrease of $30.
The Least Expensive Neighbourhoods
- Agincourt South-Malvern West was ranked as the most affordable neighbourhood this month with an average rent of $1,800.
- Yorkdale-Glen Park held steady between March to April and earned its spot as the second most affordable neighbourhood with an average of $1,820.
- After experiencing a minor $40 month-to-month decrease in its average rental price, Moss Park was ranked as the third most affordable neighbourhood this month with an average rent of $1,840.
- Towards the west end of the city, Islington-City Centre West saw a modest $10 month-to-month increase to an average rent of $1,910, earning a spot amongst the most affordable rental neighbourhoods in Toronto to rent a condo this month.
- Bayview Village saw a month-to-month decrease of $70 from $2,000 to $1,930 earning it a spot amongst the top 5 affordable rental neighbourhoods for April.
Notable Changes in Neighbourhoods Rents
Upon comparing the average rental price growth for one bedrooms in the neighbourhood between March 2019 and April 2019, a number of interesting observations appeared amongst Toronto's neighbourhoods. The neighbourhoods ranked amongst the most expensive also saw strong month-to-month growth in their average monthly rent price.
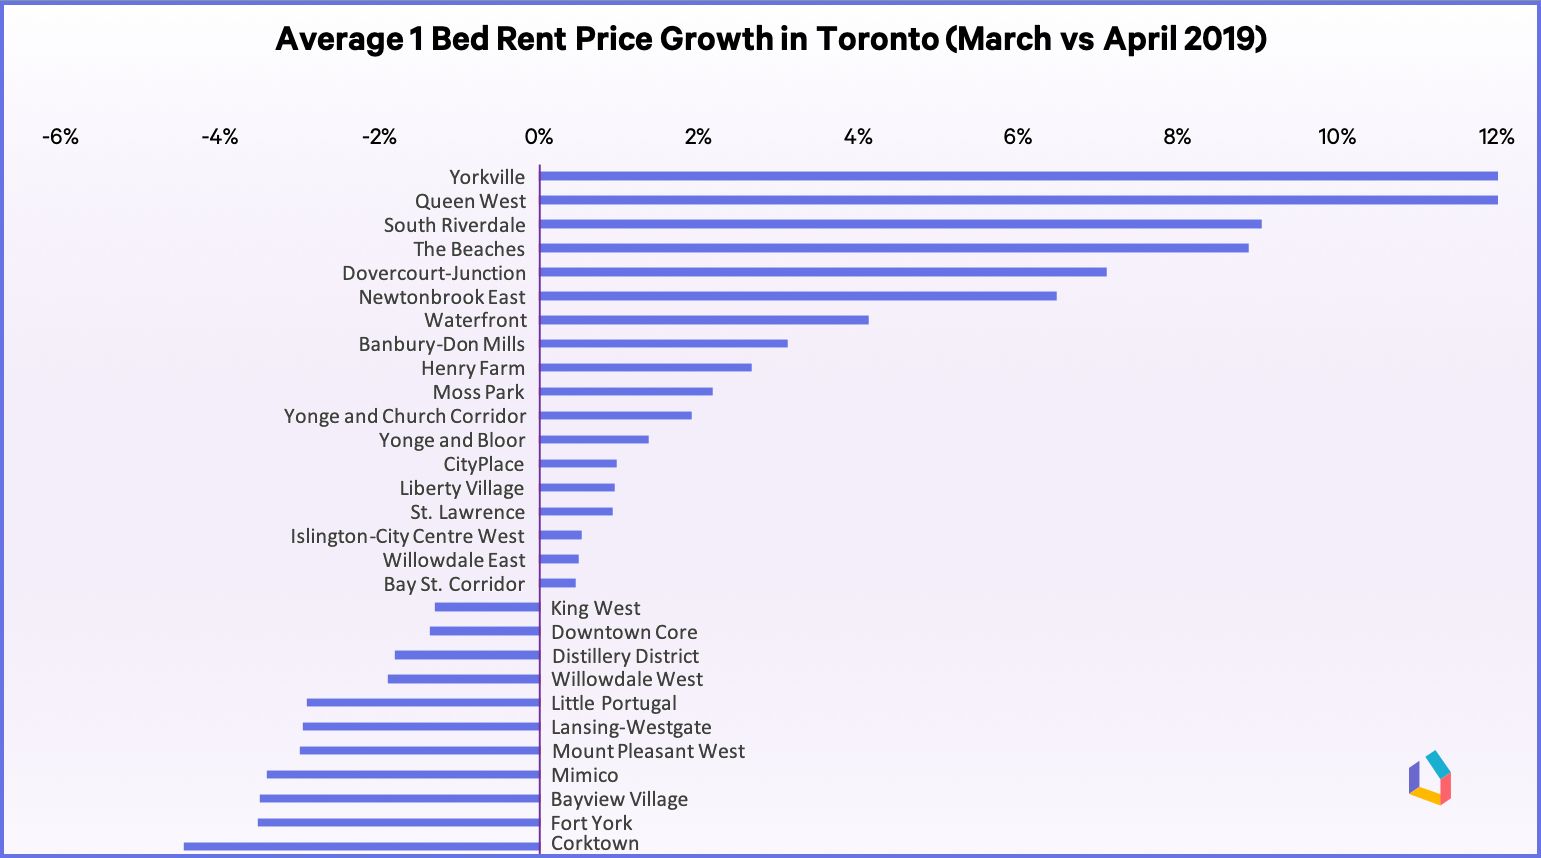
Neighbourhoods that experienced the highest rental price growth between March and April 2019
- Yorkville saw an 13% increase from $2,320 to $2,610 in the average one bedroom monthly rent between March and April 2019.
- Queen West also saw a 12% increase from $2,090 to $2,350 in the average one bedroom monthly rent between March and April 2019.
- South Riverdale saw a 9% increase from $2,100 to $2,290 in the average one bedroom monthly rent between March and April 2019.
Neighbourhoods that experienced the largest rental price decline between March and April 2019
- Corktown saw a 4% decline from $2,020 to $1,930 in the average one bedroom monthly rent between March and April 2019.
- Fort York saw a 4% decline from $2,270 to $2,190 in the average one bedroom monthly rent between March and April 2019.
- Bayview Village saw a 4% decline from $2,000 to $1,930 in the average one bedroom monthly rent between March and April 2019.
To Learn More
The Dwelly Toronto Rent Report analyzes transaction data from the Toronto Real Estate Board (TREB). Data is aggregated on a monthly basis to calculate insights for leased and sold properties in various Toronto neighbourhoods, providing a comprehensive view of the current state of the market for Toronto condos and houses.
To keep up to date with rent changes across the country, like or follow Dwelly on Facebook and Instagram. In the market for a new place? Search homes for sale and apartments for rent on Dwelly. Using Dwelly, you can find HD photos, plan commute searches and filter the map for your favourite listings.
Please note that this report is based on all data available in the month prior to publication. The report only considers neighbourhoods that had at least 5 properties leased using TREB's MLS system throughout the analyzed month. Furthermore, the data takes into account 1 Bedroom homes for rent and excludes 1 Bedroom+Den properties from the analysis.
